Trump, Reciprocal Tariffs, and the Mechanics of Global Trade
On April 2, 2025, President Trump announced "reciprocal" tariffs against almost every country in the world. The S&P 500 has had one of its largest two-day declines in history, and the market has plunged into chaos and uncertainty. While the global economy digests this news, I wanted to spend some time thinking through some of the questions and implications of this seismic shift in trade policy.
What Just Happened?
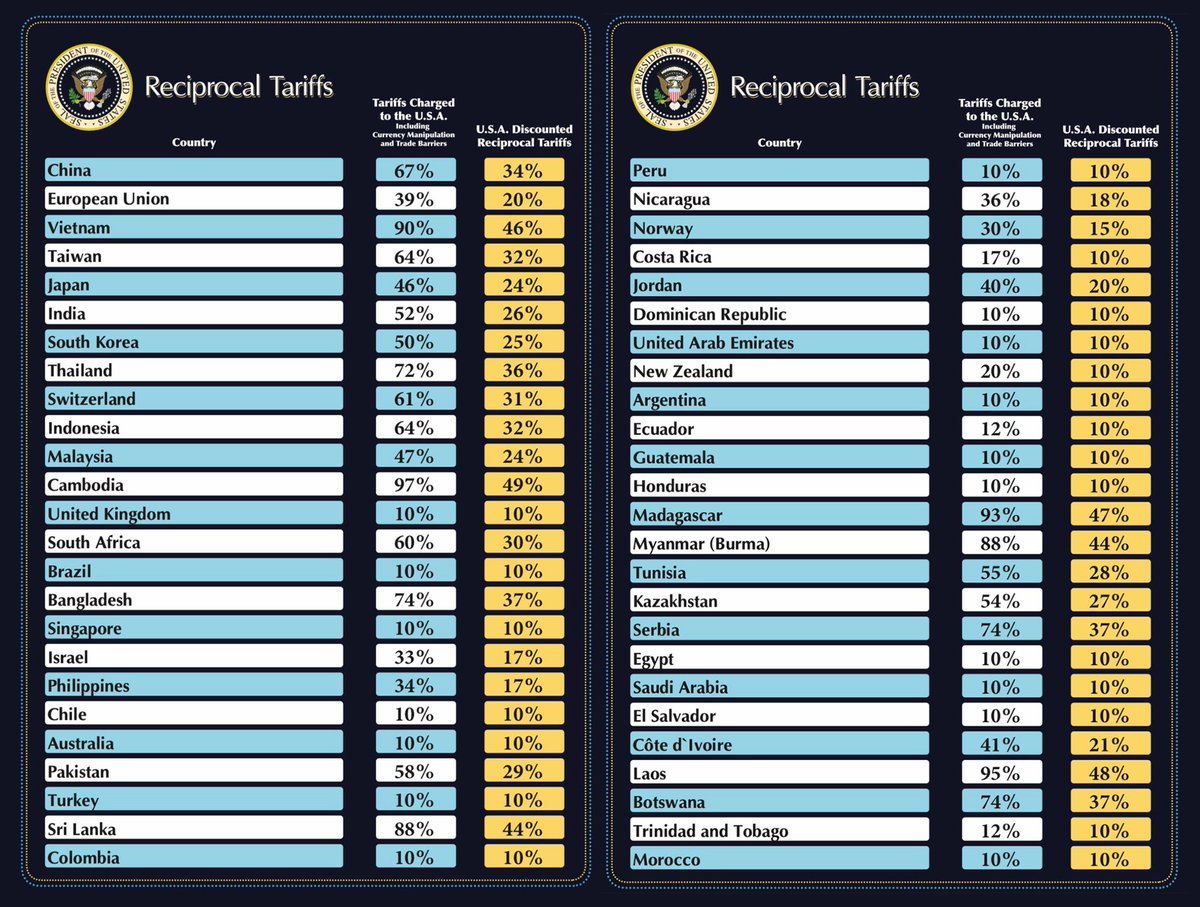
The Trump administration announced "reciprocal" tariffs against over 180 countries at half the rate of the tariffs being "charged" to the US, or a default of 10%.
The big head scratcher here is how were the "Tariffs Charged to the U.S.A." calculated? The chart includes a subscript disclaimer "Including Currency Manipulation and Trade Barriers".
After the data was released, a pattern in the calculations quickly became clear: trade deficit divided by imports.
The whitehouse later released a statement on Reciprocal Tariff Calculations, including the formula:where
- tᵢ = tariff rate on country i
- xᵢ = total exports
- mᵢ = total imports
- price elasticity of import demand, ε = 4
- passthrough from tariffs to import prices, φ = 0.25
or simply trade deficit divided by imports. This gives us the rate that the US is being "charged", so the tariff rate charged by the US is this value divided by two. For countries where the US has a trade surplus, the default rate is 10%, so the real equation becomes:
Huh?
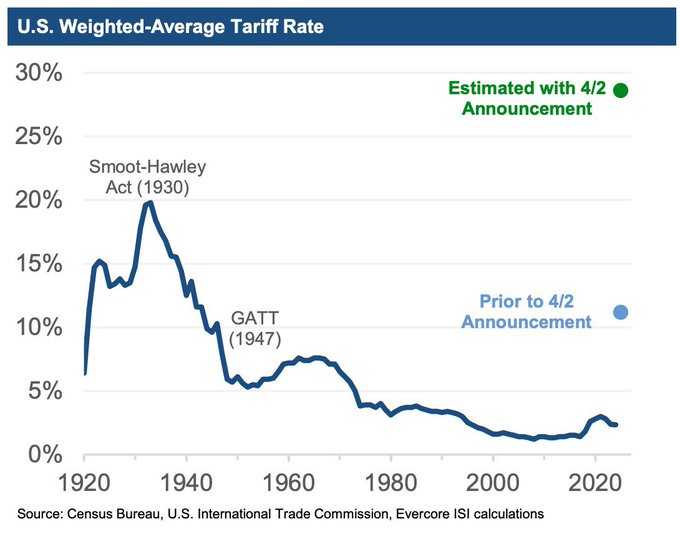
This is not what anyone was expecting. This approach not only uses a questionable method, but it also has a colossal impact: The US effective average tariff rate is now 29%, the highest in over 100 years and higher than the tariff rate set by the Smoot-Hawley Act in 1930.
Notably, here are the new tariff rates for some of America's largest trading partners (all data in millions):
| Country | Trade Surplus (Deficit) in Goods | US Exports in Goods | US Imports in Goods | Alleged "Tariff Rate" | US response |
|---|---|---|---|---|---|
| European Union | -235,571.2 | 370,189.20 | 605,760.4 | 39% | 20% |
| China | -295,401.6 | 143,545.7 | 438,947.4 | 67% | 34% |
| Japan | -68,467.7 | 79,740.80 | 148,208.6 | 46% | 24% |
| Vietnam | -123,463.0 | 13,098.20 | 136,561.2 | 90% | 46% |
| South Korea | -66,007.4 | 65,541.80 | 131,549.2 | 50% | 25% |
| Taiwan | -73,927.2 | 42,336.90 | 116,264.0 | 64% | 32% |
| India | -45,663.8 | 41,752.70 | 87,416.4 | 52% | 26% |
| United Kingdom | 11,856.9 | 79,941.30 | 68,084.5 | 10% | 10% |
| Singapore | 2,828.9 | 46,032.60 | 43,203.7 | 10% | 10% |
| Brazil | 7,350.7 | 49,667.00 | 42,316.3 | 10% | 10% |
How Do Tariffs Actually Work?
Before we consider the effects of this policy, let's step back and understand how tariffs work from the ground up
At a high level, tariffs are taxes imposed by a government on foreign imports.
Tariffs are levied against different pairings of goods and foreign nations, ranging from specific and nuanced–15% on solar panels from China–to broad and blanket: 20% on all goods from the European Union.
Each good is uniquely identified by a Harmonized System (HS) code, which can be targeted by specific tariffs. The imported goods can be final, meaning ready for sale or use, or intermediate, meaning an input for producing something else. Tariffs themselves are paid by the importing firm to the importing nation at the point of entry.
We can model the different pieces of this system using abstract interfaces:
type Nation = string                // e.g., "USA", "Canada"

type Firm = {
  name: string,                     // e.g., "American Construction Co."
  nation: Nation                    // e.g., "USA"
}

type Good = {
  name: string,                     // e.g., "Lumber"
  price: number,                    // Base price per unit
  type: "intermediate" | "final"    // Intermediate (inputs) or final (consumer goods)
}

type Tariff = {
  importer: Nation,                 // Nation imposing the tariff
  exporter: Nation,                 // Nation exporting the goods
  good: string,                     // Name of good being taxed (or "*" for all goods)
  rate: number                      // Percentage (e.g., 25 for 25%)
}

type Transaction = {
  buyer: Firm,                      // Importing company
  seller: Firm,                     // Exporting company (can be same as buyer if vertically integrated)
  good: Good,                       // What's being traded
  quantity: number,                 // Number of units
  appliedTariff: Tariff             // Relevant tariff policy
}

// Simplified Format
type TradeRecord = {
  exporter: [string, string],       // [Firm name, Nation]
  importer: [string, string],       // [Firm name, Nation]
  good: [string, number, string],   // [Name, Price, Type]
  quantity: number,
  tariffRate: number                // Percentage
}
Hypothetical: US Tariff on Canadian Lumber
Let's apply this model to the following example: the United States levies a 25% tariff on Canadian lumber, and an American construction company "American Construction Co." orders 10 shipments of lumber from Canadian firm "Canada Timber LLC".
const canadianLumberExample: TradeRecord = {
  exporter: ["Canada Timber LLC.", "Canada"],
  importer: ["American Construction Co.", "USA"],
  good: ["Lumber", 100, "intermediate"],
  quantity: 10,
  tariffRate: 25
};
Before this tariff was imposed, American Construction Co. would simply purchase the ten shipments of lumber and pay $1,000 to Canada Timber LLC. Now, after the Tariff is introduced, American Construction Co. must pay an additional $250 to the US government for the imported lumber. This extra cost likely gets passed downstream to the consumer, in this case the buyer of the home built by American Construction Co.
Who Actually Pays?
The first order effect of a tariff is pretty straightforward: the importing firm must pay the importing nation. But who actually fronts the extra cost? The answer is dependent on the good in question and its market structure. Ultimately, this is the decision of the importing firm, who can either:
- Raise prices, passing the cost of the tariff to the end consumer
- Eat the cost of the tariff and operate with lower profit margins
- Negotiate with the exporting firm for lower prices
- Switch to a domestic supplier
- Exit the market
This decision is typically driven by several key factors:
SubstitutionAre there any domestic producers of the same good the importer can switch to?
Price Elasticity of DemandHow sensitive are the end consumers to the price of the good? If the importer increases prices, how will this affect consumer demand for the good?
Profit MarginsCan the importer still operate with positive profit margins after assuming the whole or partial cost of the tariff? If profit margins go negative, how long can the firm operate, or does it make more sense to exit the market?
Tinygrad
Let's consider a real world example of a buiness walking through this decision calculus after the recent tariff announcements.
Tinygrad is an open source deep learning framework that also builds and sells a powerful, 90lb supercomputer called Tinybox.
As indicated in the Tweet, there are no domestic substitutes for GPUs or motherboards, and the motherboard manufacturer is already looking to pass the costs of tariffs onto Tinygrad. This means the only options are to increase prices, eat the cost of the tariffs, or exit the market. I imagine demand for specialized compute is relatively inelastic, and other competitors are going to have to raise prices as well, but it seems that Tinygrad has determined that the tariffs put margins in the red, and the best course of action is to exit the market.
iPhones
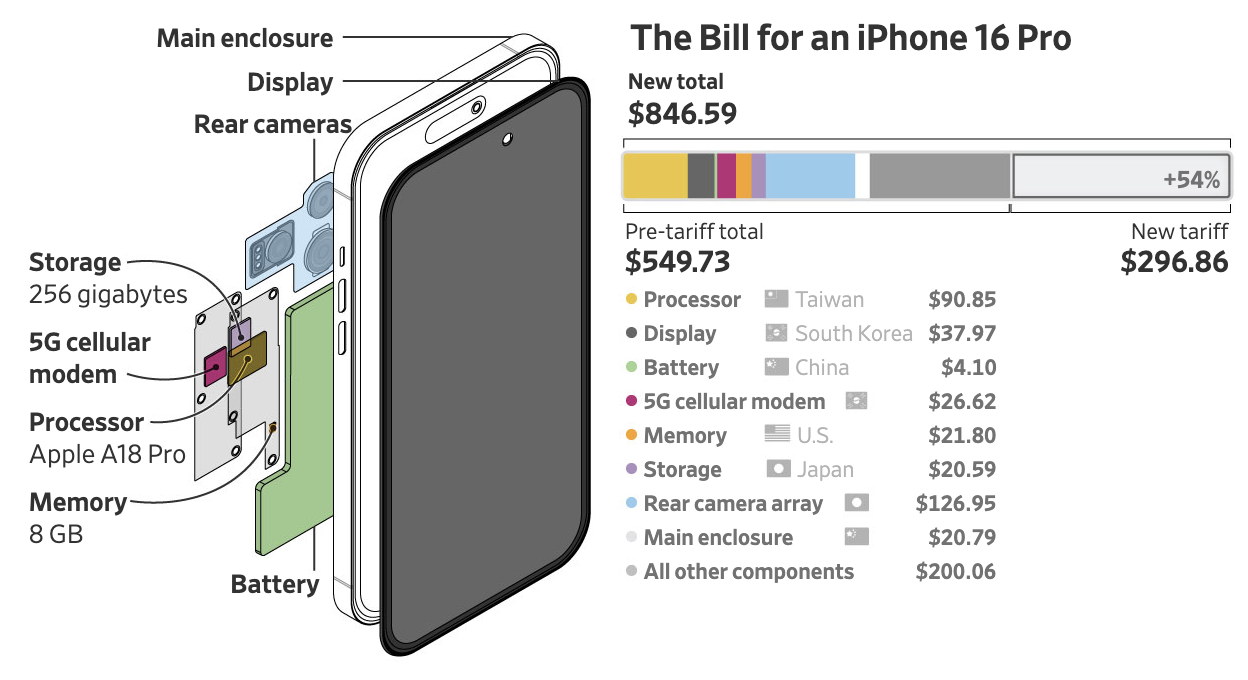
What about other more consumer oriented markets, like the market for smartphones? Apple, for example, sources internal components from various countries and manufactures iPhones primarily in China. Currently Apple charges $1,100 for a 256GB iPhone 16 Pro. The internal components previously cost ~$550. Under the new 54% tariffs on imports from China (existing 20% plus new 34%), the cost of internal components jumps up to ~$850.
Apple certainly will not be exiting the smartphone market, so the only options are to eat the cost of the tariffs, increase the price of iPhones, or migrate production to the United States. Migrating Apple's iPhone manufacturing to the US is an expensive multi-year effort, and even then the economics might not make sense given relative labor costs, so that rules out the option of onshoring, at least in the short term.
This means Apple will increase the prices of iPhones by some amount between 0 and the full cost of the tariff.What Happens Now?
Every business that deals with physical goods and foreign imports is now running the numbers and considering the same set of decisions as Tinygrad and Apple. What are some of the aggregate effects of these decisions on the broader American and global economy?
In short, nobody knows. This is a unique and unprecedented policy shift. Given the volatility of President Trump's viewpoint on tariffs, many people are waiting for a signal that the tariffs are getting rolled back. Others are speculating that this move might be intentionally chaos inducing in order to get other nations to take the tariffs seriously and show up at the negotiating table. Some believe that this might be an attempt to drive down treasury yields so the US can refinance some of its debt at lower rates. At this point, nobody knows.What to Watch
While the specific outcomes remain uncertain, if we assume the tariffs are here to stay, we can draw upon economic principles to grasp the range of possibilities. Ray Dalio recently published an article The Effects of Tariffs: How the Machine Works, which outlines the predictable first order consequences of the tariffs:- Generate revenue for the United States
- Reduce global production efficiency
- Create stagflationary pressure globally
- Shield domestic companies from foreign competitors
- Strengthen domestic production capabilities
- Reduce dependencies on foreign production and capital
The real uncertainty and economic impact lies in the second-order effects.
- Retaliation:
How will tariffed countries respond? What types of trade deals, alliances, and counter-tariffs will materialize?
- Monetary Policy:
How will central banks adjust monetary policy and interest rates? Will the federal reserve cut rates even though tariffs are expected to be inflationary?
- Supply Chain:
Will American companies actually onshore their manufacturing? Do American companies expect tariffs to last long enough to justify capital investment in moving production onshore?
What is increasingly clear is that the existing global trade infrastructure is facing a radical restructuring. The next several months will reveal whether these tariffs represent a negotiating tactic, or a fundamental economic shift. Either way, business and consumers must now navigate a dramatically altered landscape, where assumptions about globalization and free trade that have held for decades are now in question.
Appendix A: Resources and Further Reading
A non-exhaustive list of links I found helpful while researching this post:
- https://www.cbc.ca/news/business/the-full-list-of-trump-s-reciprocal-tariffs-1.7500894
- https://www.whitehouse.gov/wp-content/uploads/2025/04/Annex-I.pdf
- https://x.com/RayDalio/status/1907489922359132627
- https://x.com/Jason/status/1907843105501352021
- https://x.com/amitisinvesting/status/1907569096503271540
- https://x.com/Geiger_Capital/status/1907547963926212771
- https://x.com/orthonormalist/status/1907545265818751037
- https://www.wsj.com/tech/personal-tech/iphone-apple-tariffs-china-bb20c7a3
- https://ustr.gov/issue-areas/reciprocal-tariff-calculations
- https://ttd.wto.org/en
- https://taxfoundation.org/blog/trump-reciprocal-tariffs-calculations/
- https://www.factcheck.org/2025/04/trumps-misleading-tariff-chart/
- https://polymarket.com/event/which-countries-will-trump-tariff-in-first-100-days
- https://www.axios.com/2025/04/06/trump-tariffs-error-aei
Appendix B: What Tariff Rates are Actually Charged Against the United States?
Surprisingly, the answer to this question is not straightforward. The WTO provides granular data on tariff lines–the tariffs applied to individual goods for specific countries–and general tariff profiles, with aggregate summary statistics for each country. What seems to be missing is granular data on the specific tariff rates charged between different nations. The tariff profiles do provide some insight on the top five trading partners for a given nation. For example, in Part B of the United States tariff profile, we can see a simple and weighted average for agricultural and non-agricultural products.| Trading Partner | Weighted Avg for Agricultural Products | Weighted Avg for Non-Agricultural Products |
|---|---|---|
| China | 16.1% | 4.1% |
| Canada | 11.6% | 1.9% |
| Mexico | 17.3% | 3.0% |
| Japan | 22.6% | |
| European Union | 4.2% | 0.9% |
| United Kingdom | 0.5% |